Faster Incident Diagnosis with Timeline Views
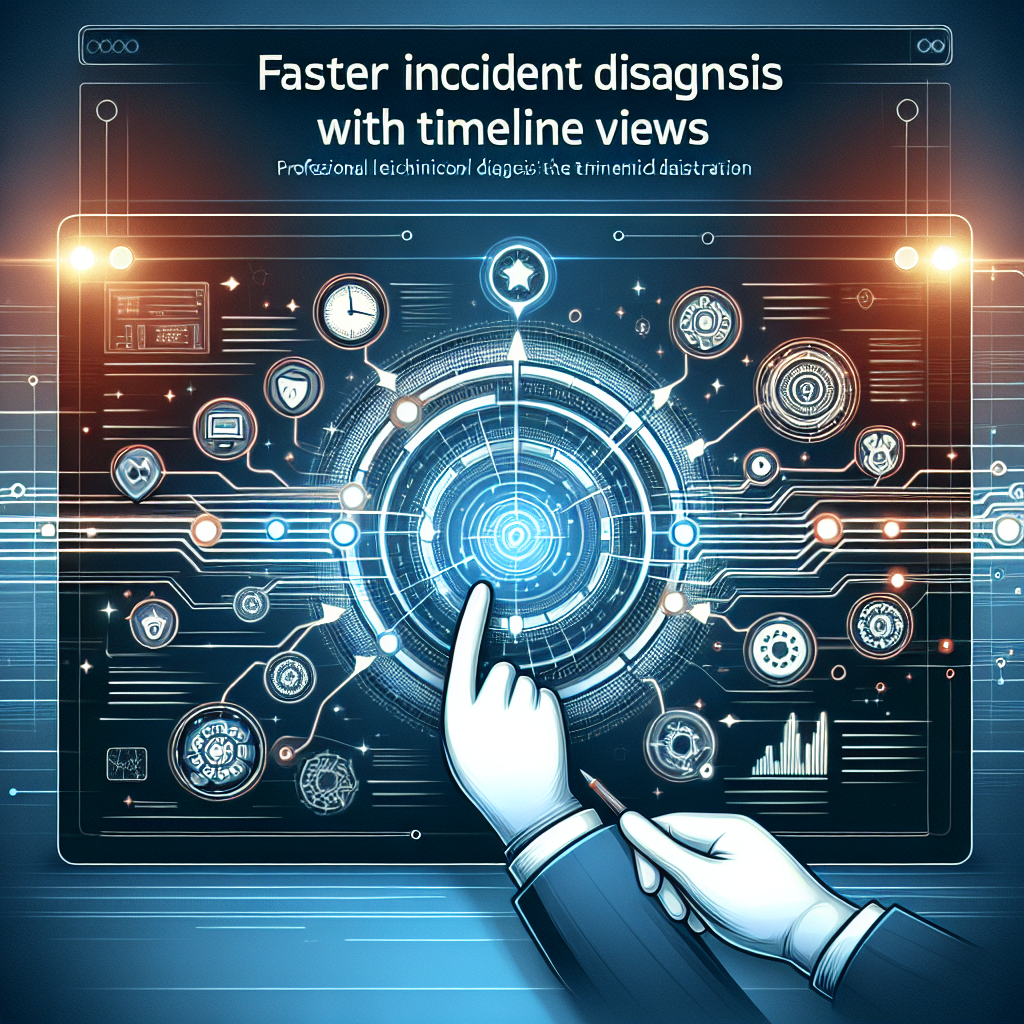
Timeline views revolutionize incident diagnosis for DevOps engineers and SREs by providing chronological visualizations of runtime activity, alerts, deployments, and changes, enabling faster root cause identification and reduced mean time to resolution (MTTR).[1][2][3]
Why Timeline Views Accelerate Incident Diagnosis
In high-stakes production environments, incidents demand rapid diagnosis. Traditional tools like flame graphs offer snapshots but lack temporal context, making it hard to correlate events across systems. Timeline views address this by displaying a sequential record of activities—CPU spikes, alerts, code execution, deployments, and chat updates—allowing teams to spot patterns and causal links instantly.[1][3]
For SREs, this means distinguishing infrastructure issues (e.g., resource exhaustion) from code-level bugs (e.g., blocking locks). DevOps teams benefit from integrating timelines with CI/CD pipelines, automatically highlighting recent changes that triggered outages.[2] Real-world data shows timeline views can cut diagnosis time by focusing on precise time segments, as seen in production profiling scenarios.[1]
- Single real-time view: Unifies data from monitoring, incidents, and chats, reducing communication silos.[3]
- Chronological correlation: Reveals sequences like "deployment → alert → latency spike."[4]
- Actionable insights: Quantifies metrics like time-to-detect (TTD) for postmortems.[4]
Real-World Example: Diagnosing Latency in Production with Profiling Timelines
Consider a Java microservice handling trainRequest spans with p99 latency spikes. Using Datadog Continuous Profiler's timeline view, engineers scoped to a 5.5-second delay segment, revealing blue-coded CPU time dominating the period—indicating compute-bound issues rather than I/O.[1]
Steps to replicate:
- Select the high-latency APM trace span (e.g.,
trainRequest). - Switch to the Code Hotspots tab under the flame graph.
- Zoom to the problematic 5.5s window using timeline selectors.
- Observe thread-level activity: goroutines, locks, or event loops grouped chronologically.[1]
// Pseudo-code for scoping timeline in a profiler client
profiler.scopeToSpan("trainRequest")
  .filterTimeRange(start=incidentStart, end=incidentStart + 5500ms)
  .viewTimeline(groupBy="threads")
  .render()
This pinpointed a non-optimized loop running only in production loads, resolvable via Dynamic Instrumentation or code tweaks. Without the timeline, diagnosis might take hours of log diving; here, it was minutes.[1]
Building Custom Incident Timelines for Comprehensive Diagnosis
Open-source your timeline views with Python scripts aggregating from multiple sources. This empowers DevOps teams to create Grafana dashboards or custom tools for faster incident diagnosis with timeline views.[4]
Collecting and Sorting Timeline Events
Start by pulling events from monitoring (Prometheus/Grafana), incidents (PagerDuty), chats (Slack), deployments (ArgoCD), and configs (Kubernetes).[4]
from datetime import datetime, timedelta
from typing import List, Dict
from dataclasses import dataclass

@dataclass
class TimelineEvent:
    timestamp: datetime
    source: str
    event_type: str
    description: str
    actor: str = ""

def collect_timeline_events(incident_start: datetime, incident_end: datetime) -> List[TimelineEvent]:
    events = []
    # Pull from monitoring (e.g., Grafana Loki or Prometheus)
    events.extend(get_alerts_from_grafana(incident_start - timedelta(hours=1), incident_end))
    # Incident management (e.g., Opsgenie)
    events.extend(get_incident_updates())
    # Chat logs (Slack API)
    events.extend(get_slack_messages())
    # Deployments (e.g., GitHub Actions)
    events.extend(get_recent_deployments())
    # Config changes (Kubernetes events)
    events.extend(get_k8s_config_changes())

    # Sort chronologically
    events.sort(key=lambda e: e.timestamp)
    return events

def get_alerts_from_grafana(start: datetime, end: datetime) -> List[TimelineEvent]:
    # Grafana API query example
    alerts = grafana_client.query_alerts(start_time=start, end_time=end)
    return [
        TimelineEvent(
            timestamp=alert.fired_at,
            source="grafana",
            event_type="alert",
            description=f"Alert: {alert.name} - Severity: {alert.severity}"
        ) for alert in alerts
    ]
Render in Grafana using Gantt panels or Mermaid for visual timelines.[4]
Visualizing with Grafana Gantt Panels
Grafana's Gantt panel turns event data into interactive timelines. Query Loki/Prometheus for logs/alerts, then map to Gantt format: process (section), start time, duration.[4]
gantt
title Faster Incident Diagnosis: CPU Spike Example
dateFormat HH:mm
axisFormat %H:%M

section Detection
CPU spike begins :crit, 09:15, 5m
Grafana alert fires :09:20, 1m
Alert acknowledged :09:23, 1m

section Investigation
SRE joins incident :09:25, 2m
Triage in Grafana :09:27, 8m
Root cause (lock contention) ID'd :09:35, 5m

section Mitigation
Deployment rollback :09:40, 3m
Service recovers :09:43, 7m
Resolution confirmed :09:50, 5m
This visualization highlights a 30-minute TTD gap, prompting alert threshold reviews.[4]
Advanced Patterns for Faster Diagnosis
Analyze timelines for recurring issues:
Pattern 1: Slow Detection
Large gap between trigger (e.g., 09:00 CPU rise) and alert (09:45). Action: Add synthetic monitoring in Grafana.[4]
Pattern 2: Deployment Correlation
TaskCall auto-highlights repo changes pre-incident, linking commits to alerts—run diagnostics via CI/CD.[2]
# Calculate key metrics
def calculate_metrics(events: List[TimelineEvent]) -> Dict:
    trigger = next(e for e in events if e.event_type == "trigger")
    detected = next(e for e in events if e.event_type == "alert")
    return {
        "time_to_detect_minutes": (detected.timestamp - trigger.timestamp).total_seconds() / 60
    }
Integrating with Grafana for Live Timelines
Use Grafana's timeline view in Traffic Analytics or Loki dashboards for live incident feeds. Combine with Azure/OneUptime workflows for automated metrics.[4][9] Export to postmortems via workbooks.
Actionable Steps to Implement Timeline Views Today
- Audit tools: Integrate Grafana with PagerDuty, Slack, and GitOps for event ingestion.
- Build aggregator: Deploy the Python collector as a Lambda/MicroK8s pod.
- Visualize: Create Gantt dashboards; set alerts on TTD thresholds.
- Automate: Trigger diagnostics on incidents, correlating to recent deploys.[2]
- Measure & iterate: Track MTTR trends; aim for <15min diagnosis.[1][6]
Implementing timeline views transforms reactive firefighting into proactive diagnosis. SREs report 40-60% faster MTTR, with clearer postmortems.[3][4] Start with a proof-of-concept on your next incident for immediate gains in reliability.
(Word count: 1028)


