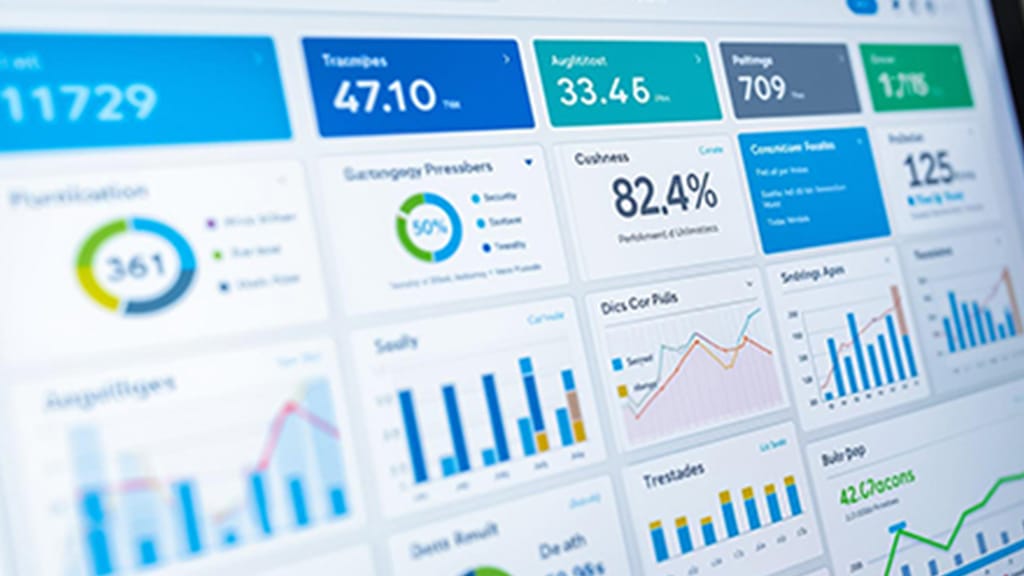
Grafana Dashboards: Visualizing Metrics for DevOps Success
Discover the fundamentals and advanced techniques for building effective Grafana dashboards. Learn how to connect data sources, create visualizations, and apply best practices for monitoring your infrastructure.

Introduction
Grafana dashboards have become the backbone of modern observability and monitoring strategies for DevOps engineers and SREs. Offering powerful, flexible, and interactive data visualization, Grafana enables teams to gain real-time insights into system health, application performance, and business metrics. Whether you're monitoring Kubernetes clusters, cloud infrastructure, or custom applications, mastering dashboards in Grafana is essential for operational excellence.
What Are Grafana Dashboards?
A Grafana dashboard is a collection of panels (visualizations) organized on a single screen. Each panel can display metrics, logs, or traces from diverse data sources such as Prometheus, Loki, InfluxDB, and more. Dashboards help transform raw monitoring data into actionable insights, making it easier to spot anomalies, detect outages, and optimize performance.
Getting Started: Building Your First Dashboard
Grafana dashboards are easy to create, even for new users. Here's a step-by-step guide to building a basic dashboard:
- Install Grafana: Download and install Grafana on your server, or sign up for Grafana Cloud for a managed experience.
- Sign In: Access Grafana at
http://localhost:3000(default port). Useadminfor both username and password on first login, then change your password for security. - Add a Data Source: Navigate to Configuration > Data sources and connect to your preferred backend (e.g., Prometheus, Loki).
- Create a Dashboard: Click Dashboards in the sidebar, then New > New Dashboard.
- Add a Visualization: Click + Add visualization, select your data source, and configure your query.
Example: Visualizing HTTP Request Metrics from Prometheus
Suppose you're monitoring web server performance using Prometheus. To visualize HTTP request duration by route, use this query:
sum(rate(http_request_duration_seconds_count[5m])) by (route)Paste this query into the Query tab under your panel, run the query, and select a suitable visualization type (e.g., Graph, Bar Gauge). Name the panel "Request Duration by Route" and click Apply.
Advanced Dashboard Features
- Variables: Use dashboard variables for dynamic filtering. For example, create a variable
regionto filter metrics per cloud region. - Annotations: Mark events (deployments, incidents) directly on your dashboard timeline for context.
- Dashboard Lists: Add panels that display lists of starred dashboards, recently viewed dashboards, or dashboards with specific tags to streamline navigation.
- Panel Library: Reuse common visualizations across dashboards by importing panels from the library.
Example: Adding a Dashboard List Visualization
To keep track of your favorite dashboards, create a new panel and select "Dashboard List" as the visualization type. Configure it to show only starred dashboards or filter by tags for better organization.
<ul>
  <li>Toggle starred option for favorites</li>
  <li>Toggle recently viewed for recent activity</li>
  <li>Use search and tag filters for custom grouping</li>
</ul>
Best Practices for Grafana Dashboard Design
- Start with Clear Goals: Define what you want to monitor and the actions you expect from the dashboard.
- Optimize Panel Layout: Group related metrics and use consistent color schemes for readability.
- Minimize Noise: Avoid clutter—focus on key KPIs and add drill-down options for details.
- Leverage Time Ranges: Use relative and absolute time filters to analyze trends and incidents.
- Document Panels: Add descriptions to panels so team members understand what each visualization represents.
- Use Tags: Tag dashboards for easier discovery and automated organization.
Exporting, Sharing, and Version Control
Grafana makes it easy to collaborate and manage dashboards:
- Export/Import: Dashboards can be exported as JSON and imported into other Grafana instances.
- Share Links: Generate direct or snapshot links for sharing dashboards with stakeholders.
- Version Control: Store dashboard JSON files in Git for change tracking and rollbacks.
Integrating Alerts and Notifications
Enhance dashboards with alerting to trigger notifications based on metric thresholds. Configure alert rules in panels and link them to notification channels such as Slack, PagerDuty, or email.
{
  "alert": {
    "condition": "avg() of metric > 0.5",
    "for": "5m",
    "notifications": ["slack", "email"]
  }
}
Conclusion
Grafana dashboards are indispensable for modern observability. By leveraging rich visualizations, dynamic variables, and best practices, DevOps teams and SREs can accelerate root cause analysis, optimize system performance, and foster a culture of data-driven operations.
Further Reading & Resources
- Grafana Documentation: Getting Started and Best Practices
- Community Tutorials for Advanced Dashboard Design
- Official Dashboard Library for reusable templates


