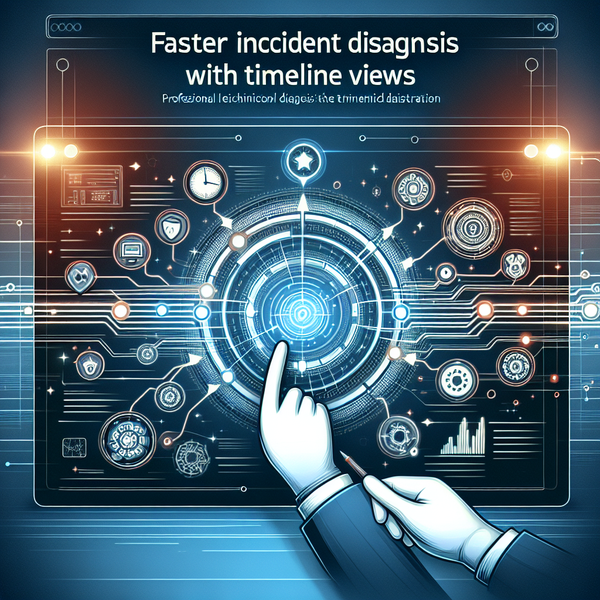
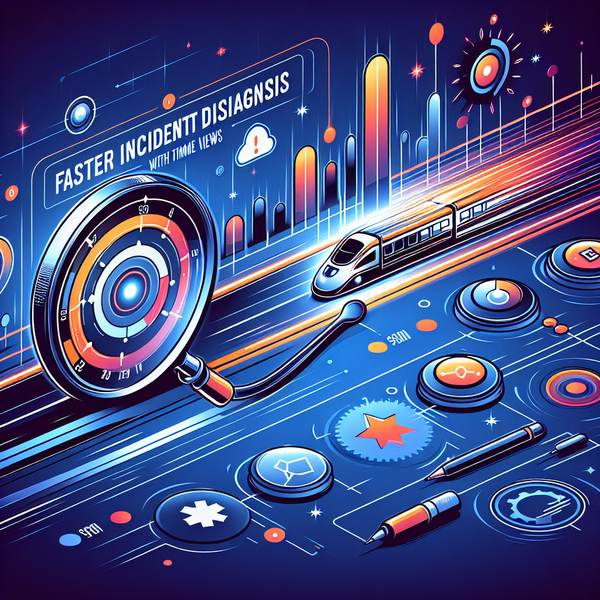
opentelemetry
# OpenTelemetry + Grafana: End-to-End Tracing Strategies
opentelemetry
# OpenTelemetry + Grafana: End-to-End Tracing Strategies
combining
For modern DevOps engineers and SREs, combining traces, logs & metrics for faster triage is the difference between a 5‑minute incident and a 5‑hour war room. Metrics tell you that something is wrong, traces show you where ,…
advanced
Advanced panel transformations & data joins let DevOps engineers and SREs turn raw metrics, logs, and events into unified, actionable dashboards instead of scattered charts. When used well, they enable you to correlate incidents with deployments, capacity with…
advanced
In modern DevOps environments, the ability to efficiently transform and combine data from multiple sources is critical for building comprehensive monitoring dashboards and generating actionable insights. Advanced panel transformations & data joins enable teams to correlate metrics, logs,…
advanced
In modern DevOps environments, raw metrics and logs tell only part of the story. The real value emerges when you can combine data from multiple sources, transform it into meaningful insights, and visualize it in a way that…
grafana
# Grafana Variables: Building Dynamic Dashboards for Modern Observability
grafana
# Grafana Mimir: The Enterprise-Grade Metrics Backend for Prometheus at Scale
grafana
Managing metrics at scale is one of the most challenging problems DevOps engineers and SREs face today. As your infrastructure grows, traditional Prometheus setups struggle with retention, scalability, and multi-tenant isolation. Grafana Mimir solves these problems by providing…
grafana
As observability demands grow exponentially, DevOps engineers and SREs face a critical challenge: how to store, query, and manage Prometheus metrics at massive scale without breaking the bank or sacrificing performance. Enter Grafana Mimir , an open-source time…
grafana
# Grafana Plugins: Extending Observability for DevOps and SRE Teams
grafana
Grafana plugins have become pivotal for DevOps engineers and SREs aiming to extend, customize, and maximize the value of their monitoring and observability stacks. In this guide, we’ll explore the types of Grafana plugins , their practical use…
grafana
Grafana plugins are a cornerstone of modern observability, empowering DevOps engineers and Site Reliability Engineers (SREs) to extend Grafana’s core capabilities far beyond basic dashboards. With Grafana plugins , teams can integrate with virtually any data source, automate…