
Understanding Prometheus Metrics: Types, Format, and Best Practices
Explore the essentials of Prometheus metrics for DevOps and SREs. Learn about metric types, labeling, exposition format, and integration with Grafana, complete with actionable examples and configuration tips.
Introduction
Modern infrastructure demands robust monitoring solutions, and Prometheus metrics have become a cornerstone for observability in cloud-native environments. DevOps engineers and SREs rely on Prometheus to collect, store, and query time series data, enabling rapid troubleshooting and real-time insight into system performance. This article explores the core concepts, metric types, exposition format, and practical usage patterns of Prometheus metrics, with actionable examples and configuration tips.
What Are Prometheus Metrics?
Prometheus metrics are time series data points defined by a metric name and a set of key/value labels. They provide multidimensional insights into system behavior, making it possible to monitor everything from infrastructure health to application-specific events. Prometheus collects metrics using a pull-based model, periodically scraping targets over HTTP, and storing the results in a purpose-built time series database.
Prometheus integrates seamlessly with orchestration platforms like Kubernetes and visualization tools such as Grafana, making it a preferred choice for scalable, flexible monitoring.
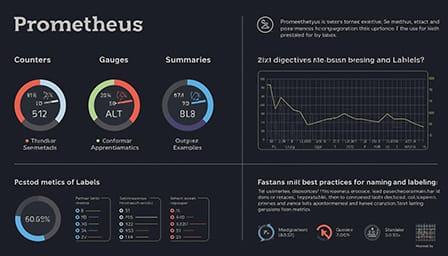
Core Metric Types
Understanding Prometheus metric types is fundamental for effective instrumentation and analysis. Prometheus supports four primary metric types:
- Counter: A cumulative metric that only increases or resets on restart. Example use cases include tracking the total number of HTTP requests or errors.
- Gauge: Represents a value that can increase or decrease, such as memory usage or concurrent requests.
- Histogram: Samples observations (e.g., request durations) and counts them in configurable buckets, exposing the count and sum for statistical analysis.
- Summary: Similar to histogram, but provides configurable quantiles, such as the 95th percentile of request durations.
Example: Metric Types in Action
# HELP http_requests_total Total number of HTTP requests.
# TYPE http_requests_total counter
http_requests_total{method="GET", status="200"} 100

# HELP node_memory_usage_bytes Memory usage in bytes.
# TYPE node_memory_usage_bytes gauge
node_memory_usage_bytes 123456789
Metric Structure and Exposition Format
Prometheus metrics are exposed in a standardized, human-readable format known as the Prometheus exposition format. Each metric includes:
- Metric Name: Identifies what is being measured (e.g.,
http_requests_total). - Labels: Key/value pairs for metadata, enabling powerful filtering (e.g.,
{method="GET",status="200"}). - Value: The current value of the metric.
- Timestamp: Usually optional; Prometheus assigns its own timestamp during scraping.
Example metric exposition:
# HELP cache_hits_total Total number of cache hits.
# TYPE cache_hits_total counter
cache_hits_total{service="api",region="us-east-1"} 4567
Instrumenting Applications with Prometheus
To export custom metrics, instrument your application using Prometheus client libraries. These libraries are available for Go, Java, Python, and many other languages. Below is a simple example using Python:
from prometheus_client import Counter, start_http_server

REQUESTS = Counter('http_requests_total', 'Total HTTP requests', ['method', 'status'])

def handle_request(method, status):
    REQUESTS.labels(method=method, status=status).inc()

if __name__ == '__main__':
    start_http_server(8000)
    # Simulate requests
    handle_request('GET', '200')
    handle_request('POST', '404')
This exposes metrics at http://localhost:8000/metrics, which Prometheus can scrape.
Configuring Prometheus to Scrape Targets
Prometheus uses a pull model, scraping metrics from predefined targets. Targets can be configured statically or discovered dynamically. Below is a sample Prometheus configuration for scraping two endpoints:
global:
  scrape_interval: 15s

scrape_configs:
  - job_name: 'app-server'
    static_configs:
      - targets: ['app1:8000', 'app2:8000']
  - job_name: 'node-exporter'
    static_configs:
      - targets: ['node-exporter:9100']
Working with Labels
Labels are essential for high-cardinality, multidimensional monitoring. They allow you to slice and dice metrics across different dimensions—such as HTTP method, status, region, or instance.
http_requests_total{method="GET", status="200", region="us-west"} 1578
Effective use of labels enables precise querying and aggregation in Prometheus and Grafana.
Querying Metrics with PromQL
Prometheus uses PromQL, a powerful query language, to select and aggregate metrics. Common PromQL queries include:
sum(http_requests_total) by (method): Sum requests by HTTP method.rate(http_requests_total[5m]): Per-second rate of requests over the last five minutes.avg_over_time(node_memory_usage_bytes[1h]): Average memory usage over the past hour.
Integrating with Grafana
For visualization, Grafana is the de-facto standard. Add Prometheus as a data source in Grafana, and build dashboards to monitor key metrics in real time. Grafana supports templating, alerting, and advanced visualizations, making it ideal for operational observability.
Best Practices for Prometheus Metrics
- Use clear, descriptive metric names and consistent label keys.
- Limit label cardinality to avoid performance issues.
- Instrument critical paths in your application for actionable observability.
- Set up alerting rules for key SLOs to enable proactive incident response.
- Regularly review and refine metrics and dashboards for operational relevance.
Conclusion
Prometheus metrics are foundational for modern observability platforms. By understanding metric types, exposition format, labeling strategies, and integration patterns, DevOps and SRE teams can achieve high-fidelity monitoring and actionable insights for robust, reliable systems.


