Understanding Prometheus Metrics: Types, Labels, and Best Practices
Explore Prometheus metrics in depth: discover metric types, labeling strategies, and practical instrumentation tips for robust observability. Learn with examples and code snippets to enhance your monitoring workflows.

Introduction
Prometheus has emerged as the de facto standard for cloud-native monitoring, enabling DevOps engineers and SREs to collect, store, and query metrics at scale. Its robust time series database, flexible data model, and seamless integration with Grafana make it an essential part of any modern observability stack. In this guide, we will demystify Prometheus metrics, explaining the core metric types, labeling strategies, and best practices for instrumentation, with practical code snippets to get you started.
What Are Prometheus Metrics?
At its core, Prometheus metrics are quantifiable data points, collected from targets (applications, systems, or exporters) and stored as time series data. Each time series consists of a metric name, a unique set of labels (key-value pairs), and a value for each timestamp. This multi-dimensional model enables powerful querying and aggregation using PromQL.[6][5]
Prometheus Metric Types
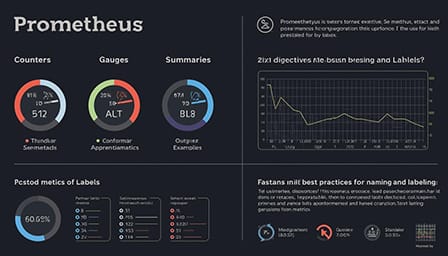
Prometheus supports four fundamental metric types, each serving a distinct purpose in observability:
- Counter: A cumulative metric that only increases or resets to zero. Counters are ideal for tracking events such as HTTP requests, errors, or jobs completed.
- Gauge: Represents a value that can go up or down, such as memory usage or temperature.
- Histogram: Samples observations and counts them in configurable buckets, providing information about value distributions (e.g., request durations).
- Summary: Similar to a histogram but provides configurable quantiles (e.g., 95th percentile latency) for precise performance analysis.
Understanding when to use each type is crucial for accurate monitoring and alerting.[2][4][5]
Counter Example
# HELP http_requests_total Total number of HTTP requests
# TYPE http_requests_total counter
http_requests_total{method="GET", status="200"} 100
http_requests_total{method="POST", status="200"} 50
http_requests_total{method="GET", status="404"} 5
This counter tracks HTTP requests, labeled by method and status code.
Gauge Example
# HELP memory_usage_bytes Current memory usage in bytes
# TYPE memory_usage_bytes gauge
memory_usage_bytes{host="app-server-1"} 524288000
This gauge shows the current memory usage, which can fluctuate over time.[3][4][5]
The Exposition Format
Prometheus metrics are exposed in a human-readable, text-based format at the /metrics endpoint of each target. Each metric entry typically contains:
- Metric name: Descriptive and unique (e.g.,
http_requests_total). - Labels: Key-value pairs for dimensionality (e.g.,
method="GET"). - Value: The observed value at a specific time.
- Timestamp: Optional, as Prometheus usually attaches the scrape time.
Comments (lines starting with #) provide context but are ignored during scraping.[3]
Labeling Best Practices
Labels are the cornerstone of Prometheus' multi-dimensional data model. They allow for fine-grained filtering and aggregation, powering advanced queries and alerts. However, improper labeling can lead to high cardinality, which increases resource consumption and can degrade performance.
- Use labels for dimensions you frequently query or aggregate by (e.g.,
method,status,instance). - Avoid dynamic or unbounded labels (e.g., user IDs, timestamps) that can create a large number of time series.
- Keep metric names and label keys descriptive but concise.
Example label usage:
http_requests_total{method="POST", status="500", handler="/api/upload"} 2Instrumenting Applications with Prometheus
Prometheus client libraries are available for popular languages (Go, Python, Java, Ruby, and more), making it easy to instrument custom metrics.
Go Example: Counter
import (
    "github.com/prometheus/client_golang/prometheus"
    "net/http"
)

var httpRequests = prometheus.NewCounterVec(
    prometheus.CounterOpts{
        Name: "http_requests_total",
        Help: "Total HTTP requests",
    },
    []string{"method", "status"},
)

func init() {
    prometheus.MustRegister(httpRequests)
}

func handler(w http.ResponseWriter, r *http.Request) {
    httpRequests.WithLabelValues(r.Method, "200").Inc()
    w.Write([]byte("Hello World"))
}

func main() {
    http.Handle("/metrics", prometheus.Handler())
    http.HandleFunc("/", handler)
    http.ListenAndServe(":8080", nil)
}
This snippet defines and registers a counter metric, incremented every request, and exposes metrics at /metrics.[3][5]
Scraping and Storing Metrics
Prometheus periodically scrapes metrics from targets based on the configured scrape_interval. Scraping uses a pull model over HTTP, typically with static configuration or service discovery. Here’s an example configuration:
global:
  scrape_interval: 15s

scrape_configs:
  - job_name: 'my-app'
    static_configs:
      - targets: ['localhost:8080']
Metrics are stored in Prometheus’ time series database, enabling historical analysis and efficient querying.[1][6]
Visualizing and Alerting on Metrics
Metrics collected by Prometheus can be visualized using Grafana, the industry standard for monitoring dashboards. Creating dashboards enables teams to monitor trends, set up SLOs, and detect anomalies. Prometheus also supports rich alerting rules, which trigger notifications based on metric thresholds:
groups:
  - name: disk_alerts
    rules:
      - alert: DiskSpaceLow
        expr: node_filesystem_free_bytes < 10 * 1024 * 1024 * 1024
        for: 5m
        labels:
          severity: critical
        annotations:
          summary: "Disk space is critically low"
AlertManager handles the delivery of alerts to email, Slack, PagerDuty, and more.[2][5][7]
Best Practices for Robust Metrics
- Instrument only what matters: Focus on business-critical and SLI/SLO-related metrics.
- Standardize metric names and labels across services for consistency.
- Regularly review and prune unused or high-cardinality metrics.
- Leverage summaries and histograms for latency and performance analysis.
- Always validate your metrics in Grafana and through PromQL queries to ensure correctness.
Conclusion
Prometheus metrics are foundational for modern observability, providing deep insights into application and infrastructure health. By understanding metric types, employing effective labeling, and following best practices, you can build a resilient monitoring pipeline that scales with your needs. Start instrumenting today and unlock the full power of Prometheus for your organization.


