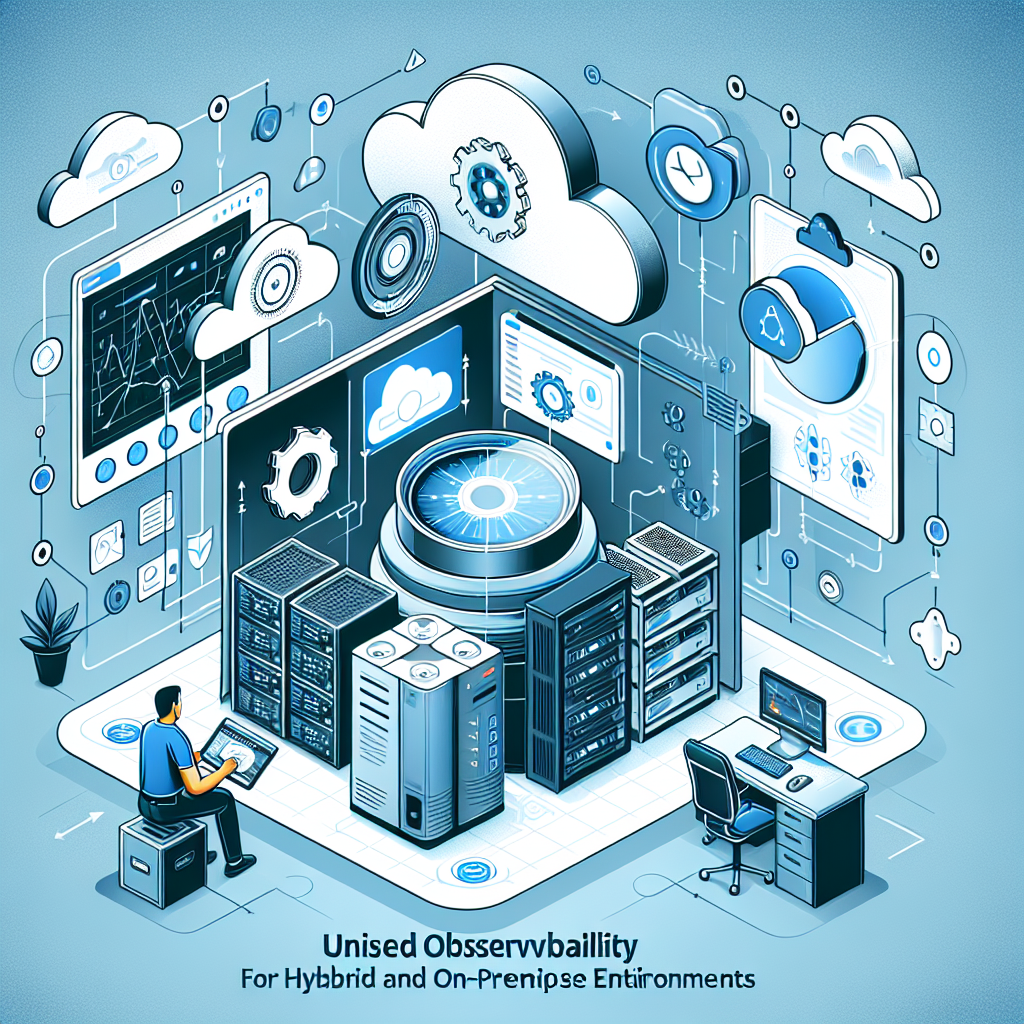
Unified Observability for Hybrid & On-Prem Environments: A Guide for DevOps Engineers and SREs
In today's distributed IT landscapes, unified observability for hybrid & on-prem environments is essential for DevOps engineers and SREs managing workloads across on-premises data centers, private clouds, public clouds, and edge locations. This approach consolidates metrics, events, logs,…

Unified Observability for Hybrid & On-Prem Environments: A Guide for DevOps Engineers and SREs
In today's distributed IT landscapes, unified observability for hybrid & on-prem environments is essential for DevOps engineers and SREs managing workloads across on-premises data centers, private clouds, public clouds, and edge locations. This approach consolidates metrics, events, logs, and traces (MELT) into a single, correlated view, enabling faster troubleshooting, proactive issue detection, and optimized performance without silos[1][2][3].
Why Unified Observability for Hybrid & On-Prem Environments Matters
Hybrid & on-prem environments combine the control of legacy infrastructure with the scalability of cloud services, but they introduce fragmentation. Traditional monitoring tools often operate in isolation—one for on-prem servers, another for AWS or Azure clouds—leading to siloed data, alert fatigue, and delayed MTTR (mean time to resolution)[1][2][3].
Key challenges include:
- Fragmented visibility: Issues in on-prem databases may cascade to cloud-hosted apps, but without correlation, root causes remain hidden[2].
- Scale and dynamism: Edge devices with limited resources and intermittent connectivity demand lightweight agents that buffer data locally[1].
- Tool sprawl: Multiple vendors generate overlapping alerts, obscuring business impact[3].
Unified observability addresses these by providing a "single pane of glass" for end-to-end visibility, leveraging standards like OpenTelemetry for data normalization and AI for correlation[1][3]. For SREs, this means reducing incident volume by up to 50% through proactive detection and automation[3]. DevOps teams gain actionable insights linking infrastructure health to business services[1].
Core Components of Unified Observability for Hybrid & On-Prem Environments
Achieving unified observability for hybrid & on-prem environments requires centralized data handling, normalization, correlation, and visualization. Here's how it works:
1. Comprehensive Data Collection
Collect MELT data from diverse sources using agentless methods, lightweight agents, API polling, or log shippers. For on-prem VMs and bare-metal servers, deploy OpenTelemetry Collectors; for edge, use resource-efficient variants that handle intermittent networks[1][2].
Practical example: Instrument a hybrid app with OpenTelemetry. On-prem, install the collector as a DaemonSet on Kubernetes:
apiVersion: apps/v1
kind: DaemonSet
metadata:
  name: otel-collector
spec:
  selector:
    matchLabels:
      app: otel-collector
  template:
    spec:
      containers:
      - name: otel-collector
        image: otel/opentelemetry-collector-contrib:latest
        command: ["./otelcol-contrib"]
        args: ["--config=/conf/otel-collector-config.yaml"]
        volumeMounts:
        - name: config
          mountPath: /conf
      volumes:
      - name: config
        configMap:
          name: otel-collector-config
This config scrapes metrics from on-prem Prometheus endpoints and exports to a central backend, ensuring consistency across hybrid setups[1].
2. Data Normalization and Correlation
Transform disparate formats into a unified schema using observability pipelines. AI/ML engines then correlate traces from cloud microservices with on-prem logs, revealing dependencies like a slow on-prem database impacting AWS Lambda latency[1][3].
For SREs, dynamic topology mapping auto-discovers assets and maps relationships, e.g., linking an on-prem Nginx proxy to cloud backend services[1].
3. Unified Visualization and Alerting
Integrated dashboards provide real-time views of hybrid health. Tools like Grafana unify panels from on-prem (e.g., Zabbix) and cloud (e.g., CloudWatch) sources via plugins[3].
Actionable Grafana dashboard query example (PromQL for hybrid CPU usage):
sum by (cluster, env) (rate(container_cpu_usage_seconds_total{job="hybrid-app"}[5m])) /
sum by (cluster, env) (container_spec_cpu_quota{job="hybrid-app"} / 100000.0)
This aggregates CPU across on-prem and cloud clusters, alerting on thresholds >80%[1].
Implementing Unified Observability for Hybrid & On-Prem Environments: Step-by-Step
Follow these actionable steps to deploy unified observability for hybrid & on-prem environments:
- Assess your stack: Inventory tools (e.g., Nagios for on-prem, Datadog for cloud) and identify gaps in MELT coverage[2].
- Adopt OpenTelemetry: Standardize instrumentation. For a Node.js app spanning hybrid:
const opentelemetry = require('@opentelemetry/sdk-node');
const { getNodeAutoInstrumentations } = require('@opentelemetry/auto-instrumentations-node');

const sdk = new opentelemetry.NodeSDK({
  instrumentations: [getNodeAutoInstrumentations()],
  traceExporter: new JaegerExporter({ endpoint: 'jaeger-hybrid-collector:14250' }),
});

sdk.start();
Export traces to a shared Jaeger backend for correlation[1].
- Set up pipelines: Use tools like Fluent Bit for lightweight log shipping from edge/on-prem to Elasticsearch or Loki.
- Enable correlation: Integrate with platforms supporting AI-driven root cause analysis, e.g., linking on-prem network latency to cloud app errors[3].
- Build dashboards: In Grafana, create service maps showing hybrid flows. Add SLO panels tracking error budgets across environments.
- Automate remediation: Use webhooks to trigger on-call workflows or auto-scale on-prem resources via Ansible when anomalies spike[1].
Pro tip for SREs: Start small—pilot with one critical service spanning on-prem and cloud—then scale. Measure success via reduced MTTR and alert noise[3].
Real-World Benefits and Best Practices
Organizations using unified observability for hybrid & on-prem environments report faster troubleshooting (e.g., correlating edge device failures to central apps) and better collaboration between DevOps, NetOps, and SecOps[1][3]. It supports frameworks like Unified Infrastructure Management Fabric (UIMF), blending observability with automation for resilience[1].
Best practices:
- Ensure consistent instrumentation to avoid blind spots[2].
- Prioritize open standards for vendor neutrality[3].
- Leverage AI for anomaly detection in dynamic workloads[1].
- Foster team adoption with shared dashboards and training[3].
In one case, a large enterprise reduced incidents by 50% by unifying views across hybrid IT, directly tying IT metrics to revenue impact[3].
Overcoming Common Pitfalls in Hybrid & On-Prem Setups
Avoid heavyweight agents on resource-constrained on-prem or edge nodes—opt for agentless polling where possible[1]. Handle data volume with smart sampling: retain 100% traces for errors, 1:1000 for healthy requests. For compliance-heavy on-prem, ensure local buffering before cloud transmission[2].
Future-proof by preparing for increasing complexity: auto-discovery and multicloud integrations will be key as workloads shift dynamically[2].
Tools and Platforms for Unified Observability
Recommended stack for DevOps/SREs:
- Grafana + Loki/Prometheus/Mimir: Open-source unification for logs/metrics/traces.
- OpenTelemetry: Universal collection layer[1].
- LogicMonitor or Chronosphere: Enterprise platforms with hybrid AI correlation[1][6].
Integrate with ITSM like ServiceNow for automated ticketing[3].
Conclusion: Achieve Clarity in Your Hybrid & On-Prem World
Unified observability for hybrid & on-prem environments empowers DevOps engineers and SREs to cut through complexity, delivering resilient operations. By implementing these strategies—starting with OpenTelemetry instrumentation and Grafana dashboards—you'll gain the visibility to optimize, automate, and innovate confidently. Begin your pilot today for measurable gains in MTTR and system reliability[1][2][3].
(Word count:


